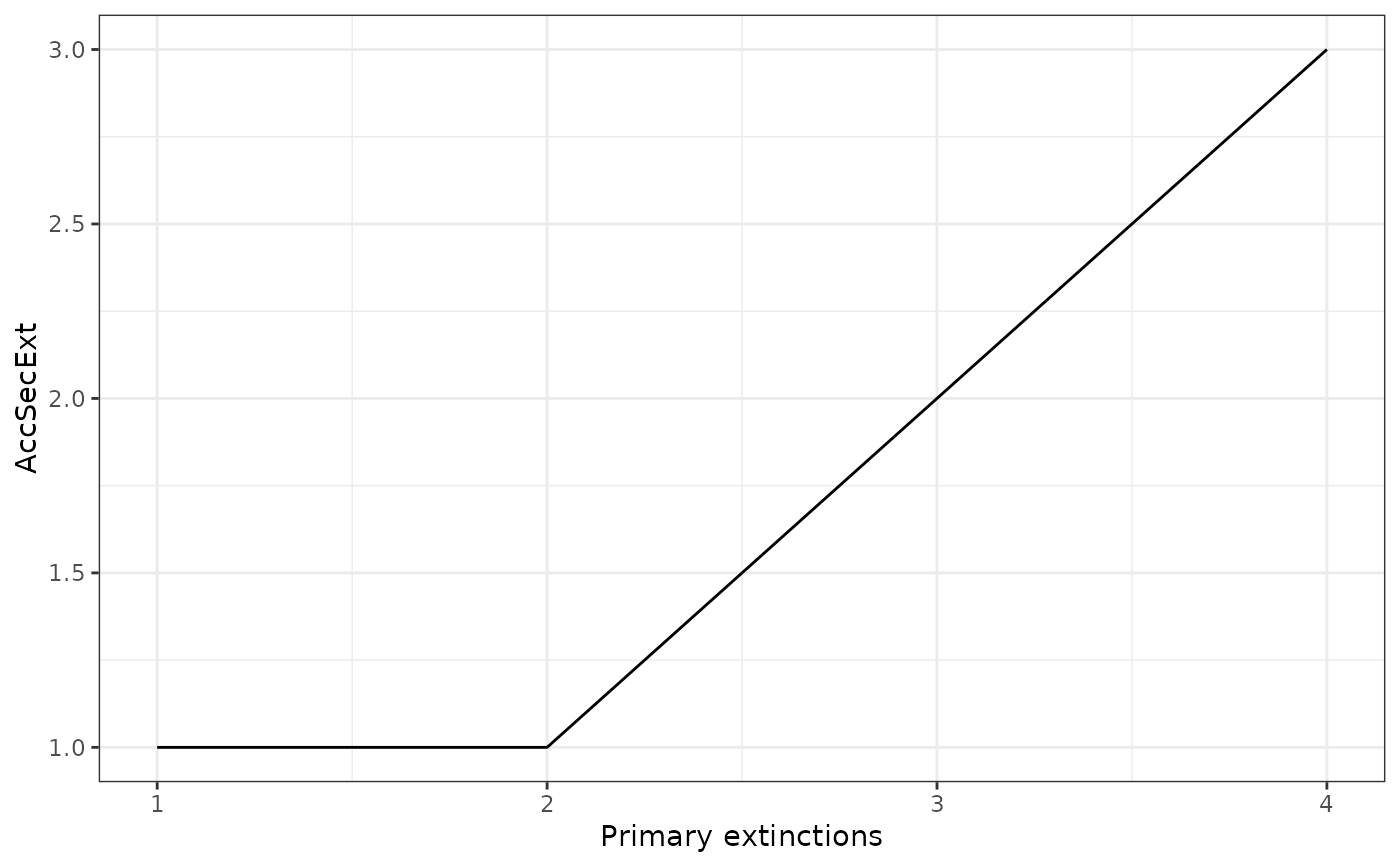
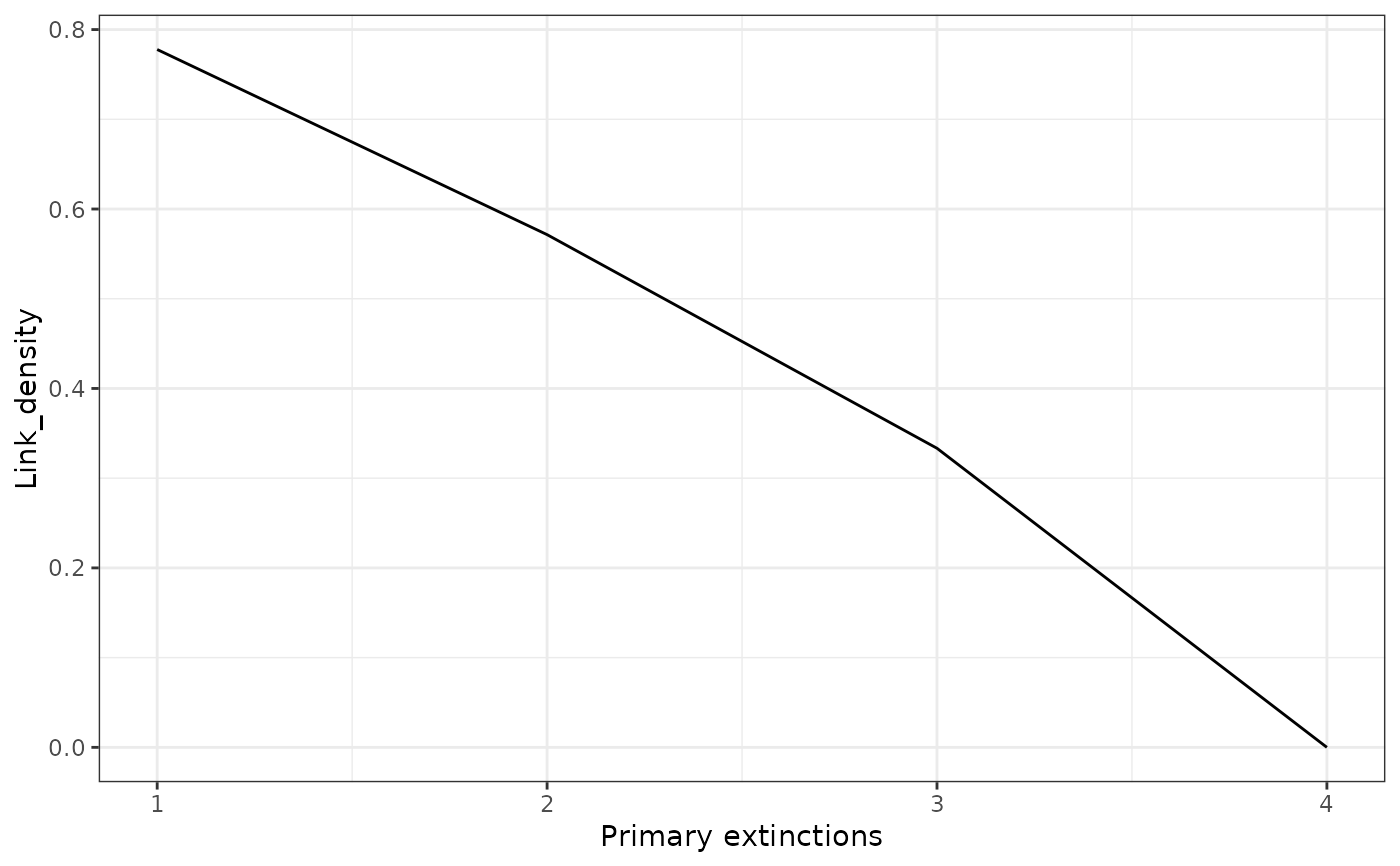
It takes a NetworkTopology class object and plots the network index after every extinction
Examples
# If you don't specify the y variable it will plot the secondary extinctions
# by default
data("net")
history <- SimulateExtinctions(Network = net, Method = "Mostconnected")
#>
  |
  |                                                                      |   0%
  |
  |=======                                                               |  10%
  |
  |==============                                                        |  20%
  |
  |=====================                                                 |  30%
  |
  |============================                                          |  40%
  |
  |======================================================================| 100%
#> Warning: Your network became completely unconnected before all primary extinctions were simulated. This happened at extinction step 4 out of 10
ExtinctionPlot(History = history$sims)

# You can also specify the variable to be ploted in the y axis
ExtinctionPlot(History = history$sims, Variable = "Link_density")

